“GRIN ツ 10-n-1” would be the device that starts the conversation about the tech, money, privacy, mining, mw, and community choices for top ten tech/features. It’s also funny because of the “10 bitcoin for 1 Grin” meme at launch.
need a windows wallet with pretty pngs and fluro buttons and play school interface for the masses. getting my mates on ubuntu for their wallets was not easy, i got yelled at while i was trying to explain grin is still developing
1 Like
1 Like
Can someone explain to me slowly why grin/beam is stable while grin/btc is not?
So Ive started on my spread sheet and well; as a sanity check is by the end of next year is there only going to be 1.7 grin for each btc?
2 Likes
https://anonfile.com/o6fej1sebf/grin_price_modeling_ods
this is my limit for today, if someone can do me a solid and convert this into graphs I will … well complain slightly less
I’ll learn the fancy math I’ll need for my model … soonish tm valve time
On the topic of math I need to learn, what sort of curve do geometric series exist on?
I’ve had a hard time not getting stupid replies for asking this sort of question with or without context as it seems fancy math poeple only care about hard correctness and are anti-practicability.
GRIN is 10-n-1 ツ
Instant • Private • Infinite • Empowered • Fair • Fun • Spendable • Mineable • Tongue-tying • Money
1 Like
The price of grin/beam may seem stable because of early press and content on youtube was mentioning both coins together. Those who heard early and adopted may be buying both coins in similar investment amounts at the same time.
By slowly I meant go into details like why other people aren’t seeing thru their premine by a different name and how fucking corporate they are, their empty forums, etc. etc. etc.
I understand beams marketing pitch, I’m having difficultly believing people are that stupid


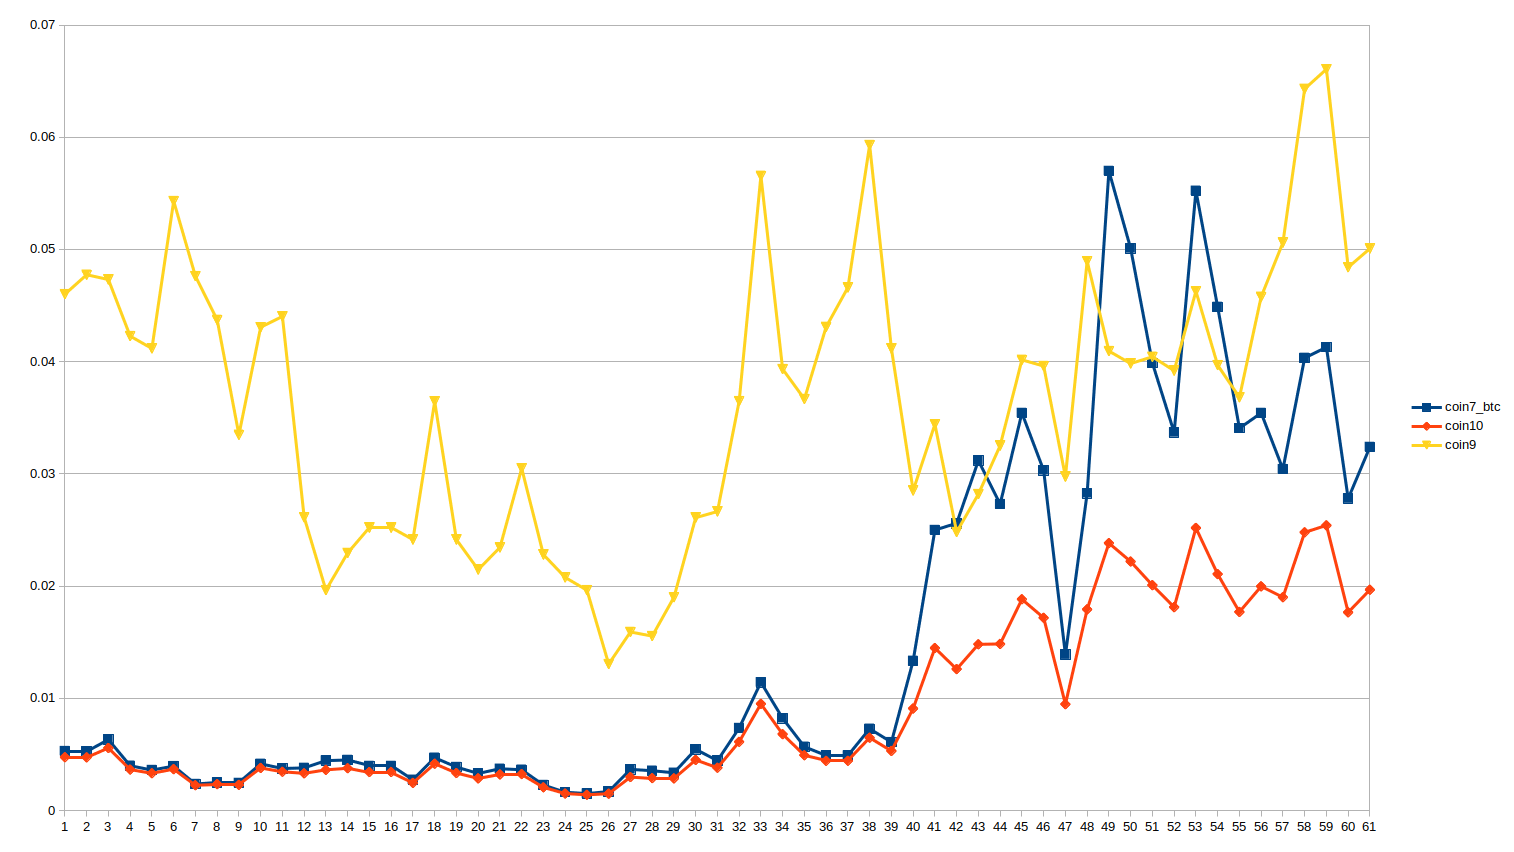


huh… there may be a slight downward trend but this looks super flat to me
I was expecting some change over time; this is 5 years of data, of a very chaotic market; why didn’t the geometericness of the top coins change; is this a bad visual showhow?
edit// with fancier data I just confirm it 


the market likes a .7 geometric curve of the top coins; I think the non-shitcoins-but-still-bads are disobeying this rule so I’ll be looking into that
edit 2//

sqrt projection of the last chart to try to get a better average… interestingly when the average(sqrt(geoness(coin9))) touched the median(sqrt(geoness(coin9)))) was the height of the shit-coin bubble if anyone would like to read to much into that; for example, prehaphs a better tier of coins need to have a lower geoness for the market to be sane
1 Like

They are labled, granted with my favor of lazy terminology (trademarked pending) and with some axes up to the reader to know from context; but labled they are
Ok let me say my question in a way more people may understand.
There have been 5 mutations of ebola, each one one after the other making it more infectious, there is a 6th in the wild with an untested infection rate but you have reasons to believe its related to the other 5. There are two scientists who are trying to predict how infectious it will be from the last 5 data points, but they get different data; one of them says infection rates are linear, the other say exponential. There is a vaccine made out of ground up puppies, and the scientist who did the linear regression may have been an animal lover and he makes the case its unnecessary as the linear regression shows its <1 infection rate; the exponential scientist is known to be paranoid, but says the his regression shows that its >1 infection rate and not grinding up puppies will kills us all.
Which scientist is right given that there is motivated reasoning on both sides and you must answer? (note in this situation your irrational enough to care about the puppies if your wrong) Your answer should include links to proper math wikipedia pages term as the author may do math by instinct and doesn’t know the right words
1 Like
Sorry monkyyy, I really do not mean to be rude, please do not take my comment personally. I just can not figure out what exactly your are showing here and I´d be happy to be illuminated.
For clarity “geoness” means “coins N marketcap / coins N - 1 Market cap” when they are sorted by market position.
From the chart “geoness with sense” for shitcoins I would make a prediction that the coin at 9th highest market cap would be * .7 the marketcap of the coin in position 8th. Given this is 5 years of data it would probaly be eventually right, or they are in the middle of trading spots.
The pattern breaks down for the top 4ish, but I have a baseline and I could throw regression at it right now; with the data to back propagate to see some error rate. But I don’t want to do that on this noisy of data without some background on what the right answer should be, as its all noisy enough its all going to look fine and give wildly different answers.
@grin1 why are you liking ancient posts of mine?
1 Like
I’ve been traveling and just now catching up with post. You are doing amazing I hope.
Inverted your charts monkyyy and they look correct at .1 GRIN = 10 BTC
1 Like